Latest Global Ecommerce Statistics (Trends to Watch)
Stats
15 Min-Read
You’re here because you want to know about the Latest Online Retail and Ecommerce Statistics and Industry Trends. Online retail and Digital commerce have become the norm, and it’s not hard to see why. From the comfort of their own homes, consumers are now able to browse a virtually endless selection of products, compare prices, and make purchases with just a few clicks. This has created an immense opportunity for businesses to reach a global customer base.
However, this means that competition is fiercer than ever before. Our aim is to provide you with a comprehensive collection of the latest data, trends, and information in the e-commerce industry, giving you the competitive edge you need to succeed. After months of research, we’ve finally prepared a collection of all the important Ecommerce Statistics and metrics that are crucial when launching a new online business.
Top Picks (Key Ecommerce Statistics)
● Global Ecom Sales Volume By The End Of 2023: $6.3T ● Ecommerce Accounts For 20.8% Of All Retail Purchases Worldwide In 2023 ● Millennials Are Prone To Impulse Purchases, With 95.1% Admitting To It ● 30% Of Us Tiktok Users Purchase Through The App ● Over 284.6 Million u.s. Consumers Are Estimated To Be Shopping Online By 2025 ● Amazon Has Over 300 Million Active Customer ● By 2030, Ai Ecommerce Solutions Are Expected To Be Worth $16.8 Billion ● A 360 Product Viewer Can Reduce Product Returns By Nearly 50%! ● Nearly 36% Of Internet Users In The Us Are Social Buyers ● 80% Of Retail Executives Anticipate The Adoption Of Ai-powered Intelligent Automation By 2027 ● M-commerce Sales Are Projected To Exceed $710 Billion In 2025.
Latest Ecommerce Industry Statistics
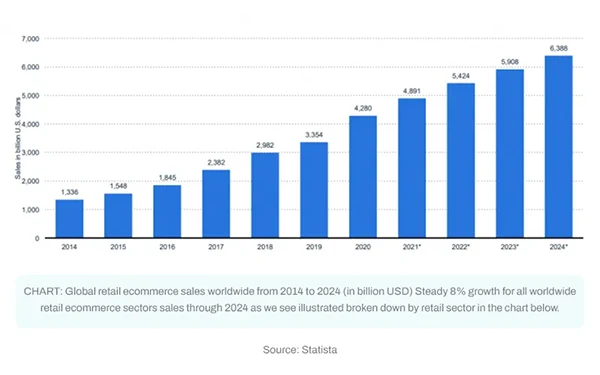
1. Total Retail Ecommerce Statistics On Sales Worldwide
The global e-commerce market is expected to experience steady growth in the coming years. In 2023, it is estimated that worldwide e-commerce sales will reach $6.310 trillion, which represents a 10.4% increase from 2022’s $5.7t and a 20.1% growth from 2021’s total of $5.2t. This indicates a growing trend toward online purchasing, with consumers becoming more and more comfortable with making purchases through digital channels.
In terms of market share, Ecommerce is estimated to account for 20.8% of all retail purchases worldwide in 2023. This trend is predicted to continue, with ecommerce sales reaching $6.913 trillion in 2024, $7.528 trillion in 2025, and $8.148 trillion in 2026, respectively. Furthermore, worldwide user penetration will be 57.3% in 2023 and will rise to 66.2% by 2027.
What does this mean for you as an Online Brand? This growth in e-commerce sales represents a significant opportunity. As consumers continue to embrace digital shopping, businesses that can successfully harness online channels to reach their customers and offer a seamless, convenient shopping experience will be well-positioned to capture a growing share of the market.
2. Ecommerce Sales And Growth By Country
In terms of market volume, China is expected to generate the most revenue in 2023, with a projected figure of $1.4t, and skyrocket to $3.3t in 2025. This growth is driven by a rapidly growing number of e-commerce users in the country, which is expected to reach 5.3b users by 2027. User penetration in China is expected to reach 83.5% in 2025.
The United States is the second largest e-commerce market in the world, with an estimated $1.1t in annual online sales by 2023. The United Kingdom comes in third with $0.91t in 2023 annual sales predictions. Other countries in the top ten largest e-commerce markets include Japan, South Korea, Germany, France, India, Canada, and Spain. Asia-Pacific represents 62.6% of the global e-commerce market.
Piechart: Ecommerce Sales By Country
Source: Statista
In each of these countries, there are major e-commerce players such as Alibaba Group in China, Amazon and eBay in the US, Amazon U.K. and Asos in the UK, Rakuten in Japan, Gmarket and Coupang in South Korea, Amazon and eBay in Germany, Amazon in France, Amazon India, Bigbasket and Flipkart in India, Amazon and Walmart in Canada, and Amazon, El Corte Ingles, and PcComponentes in Spain.
Here are the top 5 countries ranked by Retail Ecom sales growth from 2022 to 2025.
1. Brazil: CAGR 20.73%
2. Argentina: CAGR 20.69%
3. Turkey: CAGR 20.24%
4. Russia: CAGR 18.73%
5. India: CAGR 18.49
3. Demographic Profile And Purchasing Behavior
How many people actually purchase online? In 2023, over 265 million U.S. consumers are estimated to be shopping online which will increase to around 284.6 million by 2025. And In 2022 alone, over 2.3 billion consumers made at least one purchase from an online retailer. This number is estimated to increase to 2.4b by 2023 and 2.8b by 2025.
What about millennials? The convenience and accessibility of internet buying have had a significant impact on the Millennial generation. According to the study, 67% of millennials prefer to buy online, with 81.3% doing so at least once a month. This preference is attributable to the opportunity to do product and price comparisons (45%) and the availability of product reviews (80%). Furthermore, research shows that millennials are prone to impulse purchases, with 95.1% admitting to it.
This implies that internet shopping is a quick and easy way to make purchases, with 83% of millennials not concerned about security concerns. Furthermore, 40% of millennials have used voice search before making a purchase, demonstrating a desire for simplicity and convenience. More than 53% of millennials prefer to find information online.
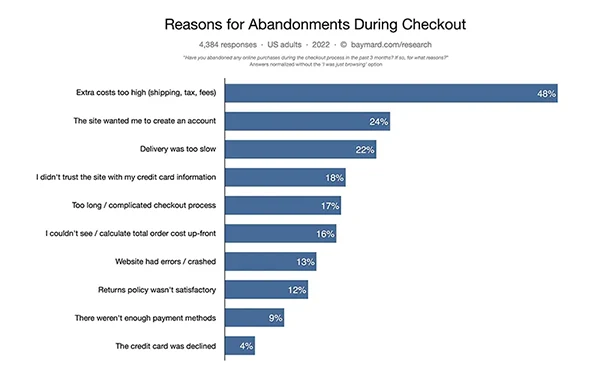
4. Conversion Rate (Cr) And Average Order Value (Aov)
Source: Baymard
70% of carts online are abandoned. Almost half of the people abandoning carts online said it was because of a change of fee at checkout due to taxes and shipping (the most prominent reason), and other reasons include: asking users to create an account, slow delivery, checkout page looked unprofessional and couldn’t be trusted, no upfront total was provided, website errors, card declines and so on.
eCommerce conversion rate = orders/number of visits X 100%
At the end of 2022 studies show that the average e-commerce conversion rate globally is 3.65%. And landing page conversions for e-commerce were around 5.2%. This might help you gauge your performance by comparing yours to the average.
The average order value globally ()as of Jan 2023) is $108. The average order value (AOV) for Luxury & Jewelry was the highest in January at $190. Over the past year, Luxury & Jewelry has consistently had the highest AOV at $180, while Home & Furniture has had the lowest at $43. The Americas have the largest AOV at $116, followed by APAC ($103) and EMEA ($101). The desktop device generates the highest AOV at $124, followed by mobile ($99) and tablet ($68).
5. What About The Competition?
How many online stores are there? Roughly 4.2 Million in the US and 12 Million Globally (as of the end of 2022). This depends on how you define an Online Store but we’re using Eommerce shopping cart, any payment technology, and Offer payment acceptance on its site as eligible criteria.
To determine the level of competition and the barriers to entry, several factors need to be taken into consideration which will dynamically diversify your odds of success:
Market saturation: The fact that there are already 12 million online stores globally doesn’t indicate that there is a high level of competition, The level of competition depends on the particular industry. However, the presence of competition can also be viewed as a positive factor, as it suggests that there are substantial profits to be gained. Some of the most lucrative e-commerce niches include fashion and clothing, beauty and personal care, household items, and electronics.
Target market and Differentiation: Identifying and targeting a specific niche or market gap that is underserved and offering one-of-a-kind items or services, great customer service, and a flawless user experience may set a new e-commerce company apart from the competition leading to a boost in the likelihood of success.
Marketing and brand awareness: Developing a strong marketing strategy and building brand awareness through various channels can help a new e-commerce store to reach its target audience and gain a competitive edge. According to Demand Metric, having a consistent brand presentation can significantly impact a brand’s visibility. In fact, brand exposure is 3.5 times better for brands that have a consistent presence than for companies that are otherwise. This, in turn, can help improve brand recognition, customer loyalty, and overall success in the market.
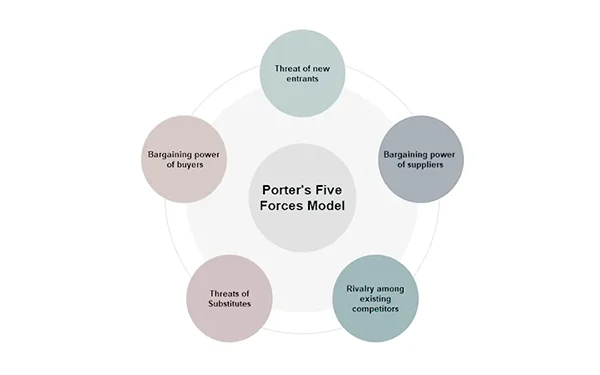
One of the famous business models that can help analyze the level of difficulty for a new e-commerce store is the Five Forces Model by Michael Porter. This model looks at five key factors: the threat of new entrants, the bargaining power of suppliers, the bargaining power of buyers, the threat of substitute products, and the intensity of competitive rivalry.
6. Leading Ecommerce Retailers By Market Share
The number one e-commerce giant is Amazon taking a whopping 37.8% of the Us market share. Here are some key amazon stats as of 2023 (Source Amazon):
Amazon has over 300 million active customer accounts and over 1.9 million, selling partners worldwide.
B2B e-commerce channel, Amazon Business, has over 1 million customer accounts, 150,000 sellers, and $10 billion in annualized sales.
Nearly 2 million small-medium businesses are Amazon third-party sellers (58% of Amazon sales come from these third-party sellers)
Third-party sales in Amazon’s stores growing at 52% per year compared to 25% for first-party sales
Over 6,500 American products sold per minute, third-party products account for over half of all units sold
Over 42 million desktop and 126 million mobile unique visitors in the US visit Amazon stores each month
Amazon is Ranked #5 on the 2020 American Customer Satisfaction Index
Second, on the list is Walmart with a market share of 6.3%. Walmart had sales of over $47.8b in 2022 and is steadily growing moving to 2025. That puts Apple third on the list with a market share of 3.9%.
Source: Statista
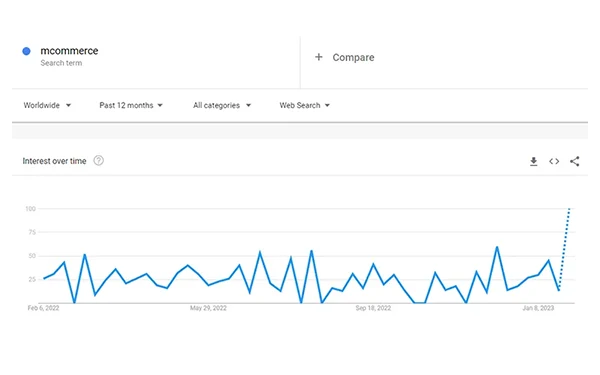
7. M-commerce (Mobile Commerce) Statistics
M-commerce, also known as mobile commerce, is the buying and selling of goods and services through mobile devices. With the increasing use of mobile devices worldwide, M-commerce has become an important aspect of the retail industry. According to a June 2022 Insider Intelligence forecast, the M-commerce share of total retail sales is expected to reach 8.7% by 2026. In 2022, M-commerce sales hit $415.93 billion, representing 6.0% of total retail sales for the year.
M-commerce sales are projected to exceed $710 billion in 2025.
Over 187 million active mobile shoppers are expected in the US by 2024.
49% of mobile users use smartphones to compare pricing.
The conversion rate for online shoppers is higher on desktop (3.9%) than on mobile (3.5%).
67% of mobile users state that small pages and links are a barrier to mobile shopping.
Over 100 billion hours are spent globally on shopping apps.
54% of mobile commerce payments are made through dedicated M-commerce apps.
The mobile commerce growth rate slowed in the past year, but still impressive.
Nearly three out of every four dollars spent on online purchases are done through a mobile device.
85% of US adults own a smartphone and 53% own a tablet, showcasing the number of potential M-commerce customers. Nearly one-third of US internet users made a purchase using their mobile device each week in 2021, and mobile devices made up 58.99% of web traffic as of 2022. Gen Z and millennials are more eager to pay for a product through mobile banking, while roughly one-third of US consumers remain skeptical about payments through smartphones and prefer to stick to credit and debit cards for major purchases. However, the number of proximity mobile payment transaction users in the US is projected to reach 125 million users by 2025.
New Ecommerce And Online Retail Trends
8. Omnichannel Commerce
Omnichannel commerce is an Ecommerce approach that focuses on providing a seamless customer experience across multiple channels, including online and brick-and-mortar stores. This strategy uses multiple channels and gives customers a unified experience, whether they are shopping on a mobile device, laptop, or in-store. Omnichannel is an evolution of the multichannel approach, where a brand is present on multiple channels but may not have a seamless experience for the customer. Omnichannel e-commerce allows customers to move from one channel to another during their online purchasing journey, optimizing the multichannel strategy for modern customers. 96% of retail executives believe consumers want a seamless experience across channels in 2022.
BOPIS (Buy Online, Pick Up In-Store) is a popular example of omnichannel retailing. This strategy allows customers to browse online and pick up their purchases in-store, providing convenience. Omnichannel strategies drive an 80% higher rate of incremental store visits according to Google, and 85% of BOPIS customers make an additional purchase in-store, leading to higher sales and basket size.
Omnichannel personalization occurs when retailers combine customer data from multiple sources, such as loyalty programs and POS data, to create an overall picture of consumer preferences. Personalization based on interests and past purchases heavily impacts purchasing decisions. Integrating the point-of-sale system with the e-commerce platform provides a holistic view of the customer’s purchase history. Brands are shifting toward first-party data in response to growing privacy concerns. In 2022, 42% of brands plan to offer personalized product recommendations and 44% of them prioritize transparency in the use of customer data.
9. Back To Brick-and-mortar?
Retailers are adapting to the changing retail landscape by incorporating technology to enhance the in-store experience and incorporating e-commerce elements into their businesses. In a recent survey, 77% of respondents considered the in-store experience important to their decision of where to shop and 83% of those consumers said they would return based on a positive experience.
Retailers may market their brand by using in-store signage, kiosk screens, and dynamic displays, as well as by using applications to contact customers outside of the shop. Many customers are eager to employ retail-specific AI technologies to save money by intelligently curating products and gaining access to discounts. Convenience and value, such as ordering online and picking up in-store alternatives, are critical for avoiding bad encounters and keeping consumers satisfied.
10. Loyalty, Referrals, And Coupons
Customer loyalty is important to 55.9% of businesses in order to overcome economic issues.
78.6% of organizations with a loyalty program plan to revamp it in the next three years.
80.0% of companies measuring the ROI of their loyalty program reported positive results, earning 4.9 times more revenue on average.
On average, 16.2 people are involved in loyalty program management, with 40.7% of businesses having a dedicated team.
88.5% of respondents trust loyalty programs for overcoming economic challenges.
28.2% of the total marketing budget goes to customer loyalty program management and CRM, with a 5.4% YoY increase.
61.0% of respondents using a loyalty technology solution vendor are satisfied with their program, while 51.1% of in-house technology solutions are satisfied.
Gamification, experience-based rewards, and predictive analytics are identified as key trends in the loyalty space over the next 2-3 years. Engaging customers in a non-transactional way through gamification is crucial for standing out from the competition. Companies focus on data collection and use for personalized customer experiences and marketing automation is crucial for creating memorable experiences.
Payments and loyalty have a close link that will be crucial in the approaching recession. In comparison to last year, mobile applications and mobile payments are less prioritized, while experience-based rewards are gaining popularity. Building consumer loyalty is just as crucial as reaching out to them via digital means. Instead of discounts, brands must capture customers’ hearts with emotional benefits.
11. Use Of “Rich Media”
With the rise of online sales and the convergence of physical and digital buying, merchants are attempting to stand out by offering the same “try before you buy” experience online as they do in-store. It’s important for retailers to determine which Rich Media asset appeals best to target customers for a specific category, as a one size fits all approach doesn’t work across all product categories.
360 Product Viewer: A 360 product viewer is a digital view of a product that shows it from all sides and angles and can be an interactive image, GIF, or video. A 5% – 40% increase in sales will be achieved with the adoption of 360 product views. Adobe’s study shows that 91% of medium-to-heavy consumers online believe a 360-degree product viewer is a must-have. A 360 product viewer can reduce product returns by nearly 50%!
Video Content: 73% of consumers believe a product demo best assists them when making a purchase decision and they are more likely to purchase after seeing it unboxed. In 2020, Google reported that video content accounted for 74% of all online traffic and those video ads had an average click-through rate (CTR) of 1.84%, compared to a 0.3% CTR for display ads. And 55% of consumers use videos for purchase decisions. Another study by Forbes Insights found that videos on landing pages can increase conversions by 86%. Most website builders have easy widgets to add video content these days.
Product Carousels: Product carousels are a feature in e-commerce websites and apps that allow customers to scroll through multiple product images rather than one hero image. Product carousels can increase the average time spent on a website by 20-40%. They can also help improve mobile usability and user engagement, as they provide a more visually engaging experience.
Use of AR: AR, which combines virtual and real-world aspects, bridges the gap between physical and online buying experiences and is widely employed in a variety of sectors. A consumer AR survey by Google found that 66% of people are interested in using augmented reality technology for help when shopping and global spending on AR/VR was estimated to be up to $18.8 billion in 2020. But still, by the end of 2022, 52% of retailers were not prepared to integrate AR into their retail.
Having a good website design with attractive composition and fonts is a good start in the world of e-commerce. However, to succeed and stay up-to-date with the latest trends, it is essential to implement high-quality content strategies as well.
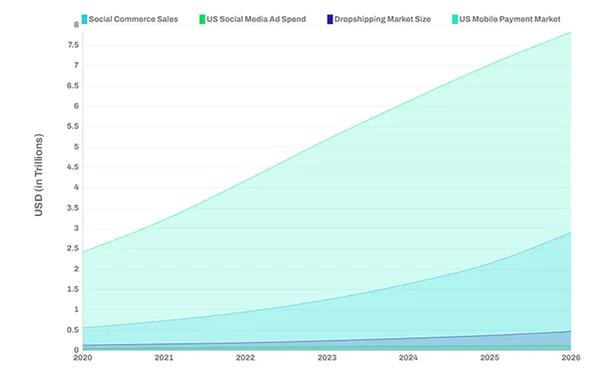
12. Social Media Commerce
Imagine scrolling through your social media feed, catching up on friends’ activities and the day’s news. Suddenly, you come across a sponsored post by an apparel brand featuring a product that catches your eye. With just a few clicks, you are able to purchase the product directly from the social media app without having to leave it. That’s social commerce. Every day a person spends 2+ hours on average scrolling through social media. Although we do not recommend you scroll through your social media all day, This is a perfect opportunity for you as a business owner. The US social ecommerce market grew by almost 38% to $26.77 billion in 2020 and is expected to surpass $50 billion annually by 2023.
30% of US TikTok users say they have made a purchase through the app
According to our calculations, Roughly 39% of internet users in the US will make at least one social commerce purchase in 2023.
Nearly 36% of internet users in the US are social buyers, which is approximately 110.2 million people.
70% of internet users in the US who regularly watched live streams were likely to buy products recommended by influencers
The US had about 79 million social buyers in 2020, and this number is estimated to grow to 108 million by 2025
Apparel and accessories are the largest categories for social commerce
Over 75% of social commerce purchases are made on mobile devices
13. Automated – Personalized Experiences
By integrating unique customer data to produce dynamic content in ecommerce businesses, customized ecommerce focuses on automatically offering customers a unique and personalized buying experience. It is done based on data such as demographics, search or browsing activity, purchase history, website engagement, and other factors. Personalization reaches clients across numerous channels and has been demonstrated to increase conversion rates by 10-15% and customer satisfaction rates by 20%. This is a crucial part of long-term success for organizations since maintaining consumers is less expensive than obtaining new ones.
14. The Use Of Ai In Online Stores
Businesses were drowning in a sea of data, unsure of how to use it to their advantage. They tried various methods to enhance the customer experience, but nothing seemed to work. That was until artificial intelligence (AI) came to their rescue. The use of AI in ecommerce is growing rapidly, with over half of the Ecommerce businesses (51%) already using it to improve customer experience. This trend is expected to continue, with 80% of retail executives anticipating the adoption of AI-powered intelligent automation by 2027. AI-powered chatbots are also becoming more popular, with 1.4 billion people using them globally and enhancing sales by 67%. With the help of AI, retailers are able to gather customer data, analyze it, and use it to offer personalized product recommendations, optimize pricing, and generate customer insights.
Machine learning enables AI to respond fast to both micro and macro changes, resulting in a better user experience and higher conversion rates and revenue. AI is also being utilized to make sales processes more efficient, automate follow-up inquiries, and deliver virtual personal shopping experiences. eCommerce organizations can make educated judgments and alter their marketing efforts with the aid of AI and data. AI is a fundamental component of personalization, allowing personalization ROI to swiftly outperform that of traditional mass marketing.
Here are some Statistics on the use of Ai in the Ecommerce Space:
By 2023, organizations utilizing AI are projected to have a 25% rise in customer satisfaction.
AI-powered chatbots are 30% cheaper than human customer service representatives. Globally, 1.4 billion people use chatbots and they increase sales by 67%.
80% of retail executives predict their companies will adopt AI-driven intelligent automation by 2027.
40% of consumers expect chatbots to provide them with discounts and special shopping offers.
78% of brands either have or plan to implement AI in their online stores.
By 2030, AI Ecommerce solutions are expected to be worth $16.8 billion.
40% of consumers turn to chatbots to search for offers and deals.
Only 7% of companies don’t use AI but are considering it.
48% of companies use AI to solve data quality issues.
75% of executives are concerned about going out of business within five years if they don’t adopt AI.
15. Improving Customer Support
In order to improve customer service, you must focus on technology and agent skills. As customers become more willing to engage with brands over social and messaging channels, online brands are expected to turn to automation to solve customer service challenges and re-evaluate who is responsible for managing customer service. According to a PwC study, 73% of consumers believe that support service experiences are more important to their purchasing decisions than price or product features.
Here are some important CS metrics:
Nearly two-thirds of customers will recommend a brand if they receive outstanding customer service.
Half of consumers will switch to a competitor after a single negative experience.
Only a fifth of consumers believe customer service meets their expectations.
Nearly 60% of consumers believe customer experience plays a crucial role in choosing a brand.
40% of US companies face the challenge of lack of collaboration between departments in optimizing the customer experience
Most customers are willing to pay more for a positive customer experience.
Nearly 59% of consumers rate their AI customer service interactions 8 or higher out of 10.
A majority of agents feel overwhelmed and could benefit from automation and AI.
Three-quarters of customers expect personalization.
Two-thirds of customers will spend more with brands that understand and treat them individually.
Summary And Future Outlook
Ecommerce continues to evolve and dominate the retail landscape, and as a brand, you must stay ahead of the curve. With global ecommerce sales projected to reach $6.3 trillion by 2023 and 20.8% of all retail purchases happening online, you need a strong online presence and a personalized omnichannel experience to drive sales and set yourself apart. This requires a deep understanding of consumer behavior, keeping up with industry trends such as mobile shopping and social media marketing, and continuously optimizing your website’s conversion rate. While transparency is valuable for building customer relationships, it’s not as impactful as pricing and convenience.
The future of ecommerce is a world of limitless possibilities and seamless experiences, where technology has altered the way we purchase and sell. The future of ecommerce is going to transform the game fundamentally, from virtual and augmented reality purchasing to AI-powered personalization and beyond.
What Does Today’s Ecommerce Customer Really Care About?
Let’s cut right to the chase, Convenience, A seamless buying experience, Multichannel shopping, Flexible payment choices, and Delivery convenience are the five primary things customers REALLY want. Businesses should focus on giving clients with fast and simple free delivery, tailored suggestions, bargains, discounts, price match pledges, social proof, and simple and free returns. Customers also prefer communication and the opportunity to track their orders. Businesses should connect with clients in the manner in which they choose, such as through text messages, in order to keep them informed and create a strong relationship with them.
Convenience: Convenience is a key driver for consumer shopping behavior and can be achieved through several means such as easy-to-use interfaces, fast shipping, and flexible return policies. A survey by Accenture found that 70% of consumers rated convenience as the most important factor when shopping online.
Frictionless Shopping Experience: A frictionless shopping experience refers to the ease of navigating a store and making a purchase with minimal obstacles. A study by Salesforce found that 40% of customers abandoned their shopping carts due to a complicated checkout process.
Omnichannel Shopping: theability to shop across multiple channels, such as online, in-store, and via mobile. A study by Deloitte found that customers who engage with brands through multiple channels are 9% more loyal and make up to 15% more purchases compared to those who shop through one channel.
Flexible Payment Options: Offering a variety of payment options to customers can increase conversion rates and customer satisfaction. A study by Business Insider found that customers are more likely to complete a purchase if the website offers their preferred payment method. This one is a no-brainer.
Delivery Convenience: The word of the day is “convenience”. Your customers should receive packages quickly and at a time that is convenient for them. A survey by UPS found that 80% of customers are more likely to shop from a retailer again if they offer free shipping. Additionally, a study by MetaPack found that 48% of customers rated delivery speed as the most important factor when receiving a package.